可持续性
在 BioLogiQ 公司里面 "可持续性发展"不仅是一个流行词,而是融入我们核心业务的指导原则。 我们相信,一个蓬勃发展的公司有能力也应该与一个繁荣的地球和谐共存。
BioLogiQ 的核心价值就是,我们知道今天的选择会影响明天的世界。 这就是我们努力为塑料行业设定新标准的原因。 我们的奉献精神不仅体现了我们的价值观,也是对我们的客户、员工和全球社会的承诺。
请加入我们,不断创新,携手合作,取得成功,改进当今的塑料行业,创造更美好的明天。 无论是一大步还是一小步,减少塑料过程中,每 1% 都是迈向可持续发展未来。
以植物基为核心实现最佳性能
通过我们的专利技术,我们能够将 NuPlastiQ 与传统塑料、生物基塑料和再生塑料等复合。 NuPlastiQ 的多功能性意味着它可以与多种不同的塑料树脂复合,为造粒厂和加工商提供显着的灵活性,以推动可持续发展。
此外,在消费后回收塑料中添加 NuPlastiQ 可以简化造粒过程,并与回收材料结合使用(更容易制造和更多回收成分),实现双赢。
更少的原生塑料意味着更少的化石燃料、更少的污染物以及减少对长期影响的担忧。

以植物基驱动
及其复合材料 BioBlends
BioLogiQ 致力于使用革命性的百分之百植物基生物聚合物 NuPlastiQ 来实现真正的循环经济。
NuPlastiQ 是解决塑料污染的天然方案。 NuPlastiQ 减少了环境和海洋中塑料污染*的积累。
NuPlastiQ 是解决塑料污染的天然方案。
致力于使塑料可持续发展
BioLogiQ 的 NuPlastiQ 由每年可再生的植物基材料资源制成。
提高可持续性的方案是寻找如何减少塑料用量,重复使用和回收塑料产品的方法。 过去十年来,3R(减少、再利用和回收)一直是塑料行业关注的焦点,但这一过程还不够成功,每年预计将有超过 1100 万吨(按 PEW 计算)的塑料流入海洋。
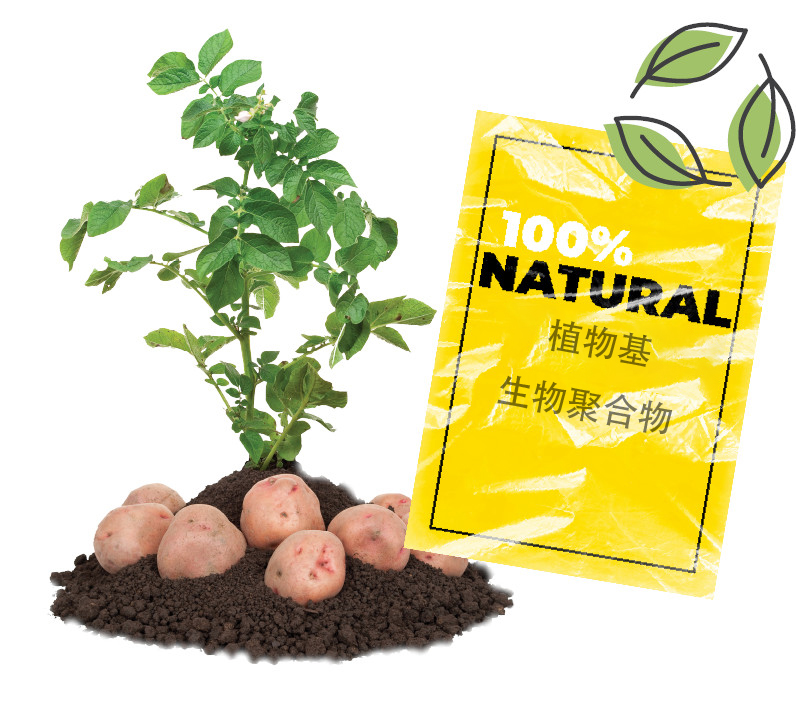
3R(减少、再利用和回收)是通往可持续未来的重要组成部分,BioLogiQ 持续创新可靠的解决方案。
减少温室气体排放
BioLogiQ致力于保持我们在这个星球上所享受的生活质量。过去100年来对化石燃料的过度依赖引起了全世界对气候变化、长期污染以及“化石燃料总体上是一种有限资源”这一事实的关注。
我们用可再生的淀粉 ( NuPlastiQ 树脂) 而不是化石燃料来制造塑料,以解决许多有效的问题。
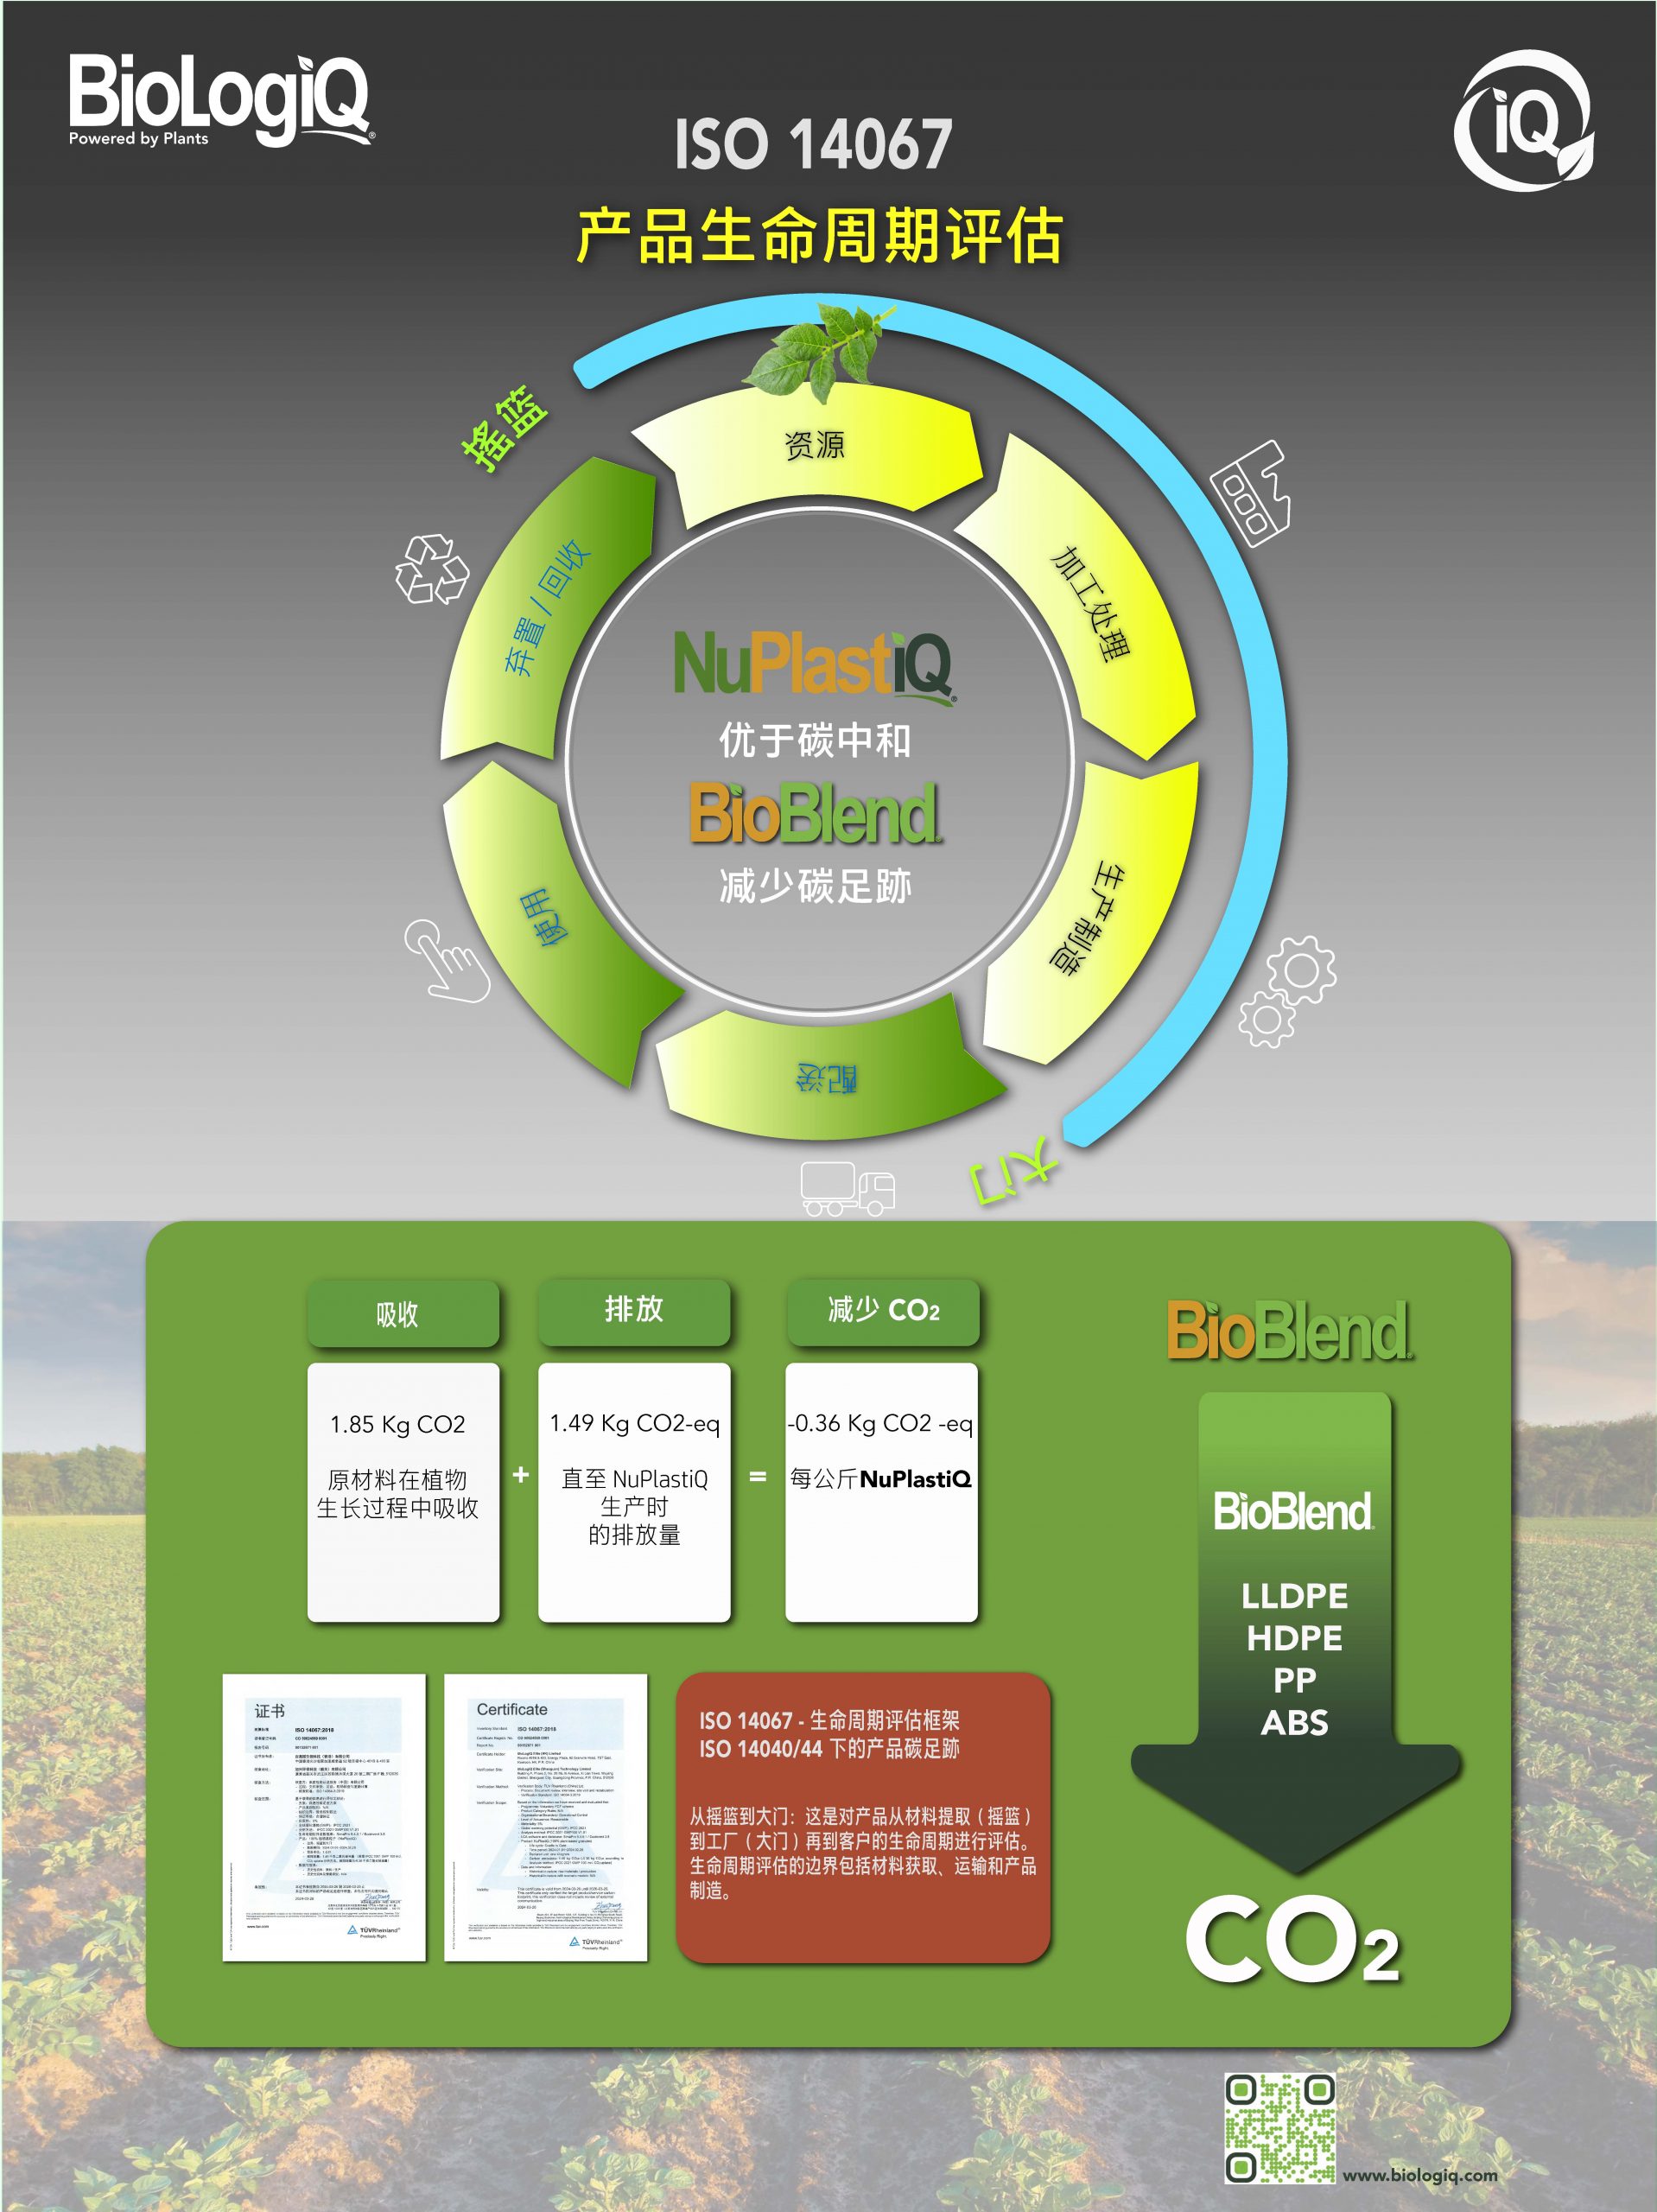
将NuPlastiQ生物聚合树脂与任何一种石油基塑料树脂混合使用,都会对碳排放(CO2)产生巨大而直接的影响,2最终将改善日益严重的“温室气体”问题。我们的树脂可以替代部分PE、PP或PS等传统塑料。制造商不需要特殊设备来使用我们的树脂,也不会增加人工成本,使用非常方便。
- :
-
-
- [-0.05 + 1.40]
- .:
- .
- .
.
.
.
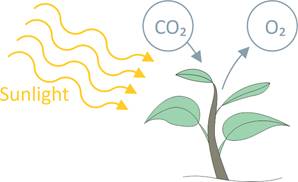
I. NuPlastiQ is a plant-based thermoplastic. Every carbon in its backbone came from atmospheric CO2.
- Plants use sunlight (light energy) to make “foods” (chemical energy) from carbon dioxide CO2 and water H2O;
- This chemical energy is stored in carbohydrate molecules, such as starches and sugars;
- The basic chemical formula of starch, our primary ingredient for NuPlastiQ, is (C6H10O5)n and its carbon atoms came from atmospheric CO2;
- The same goes for plant-based Glycerin, the other ingredient in NuPlastiQ. With chemical formula C3H8O3, all its carbons came from atmospheric CO2.
II. CO2 uptake to make one kilogram of NuPlastiQ :
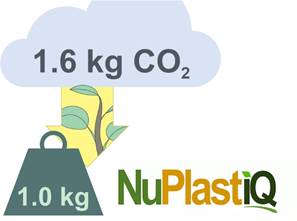
Carbon atoms in one kilogram of NuPlastiQ were absorbed by plants from the atmosphere during photosynthesis as ~1.6 kilograms of CO2.
- 1 kg of NuPlastiQ consists of approximately 440 grams of carbon, 60 grams of hydrogen and 500 grams of oxygen;
- 1 kg of CO2 consists of approximately 273 grams of carbon and 727 grams of oxygen;
- In order to obtain the 440 grams of carbon needed to make 1 kg of NuPlastiQ, ~1.6 kg of CO2 needs to be taken from the atmosphere by plants (440 ÷ 273≈1.6).
Note: If NuPlastiQ is biodegraded at the end of its life, its carbons are returned to the atmosphere in the form of CO2 or the less desirable CH4.
III. CO2 emissions to make one kilogram of NuPlastiQ :
There’s a lot of work to convert atmospheric CO2 into ready-to-use NuPlastiQ:
Diesel for agriculture, fertilizer production and use-related emissions, energy for starch and NuPlastiQ processing, diesel for transportation, etc.
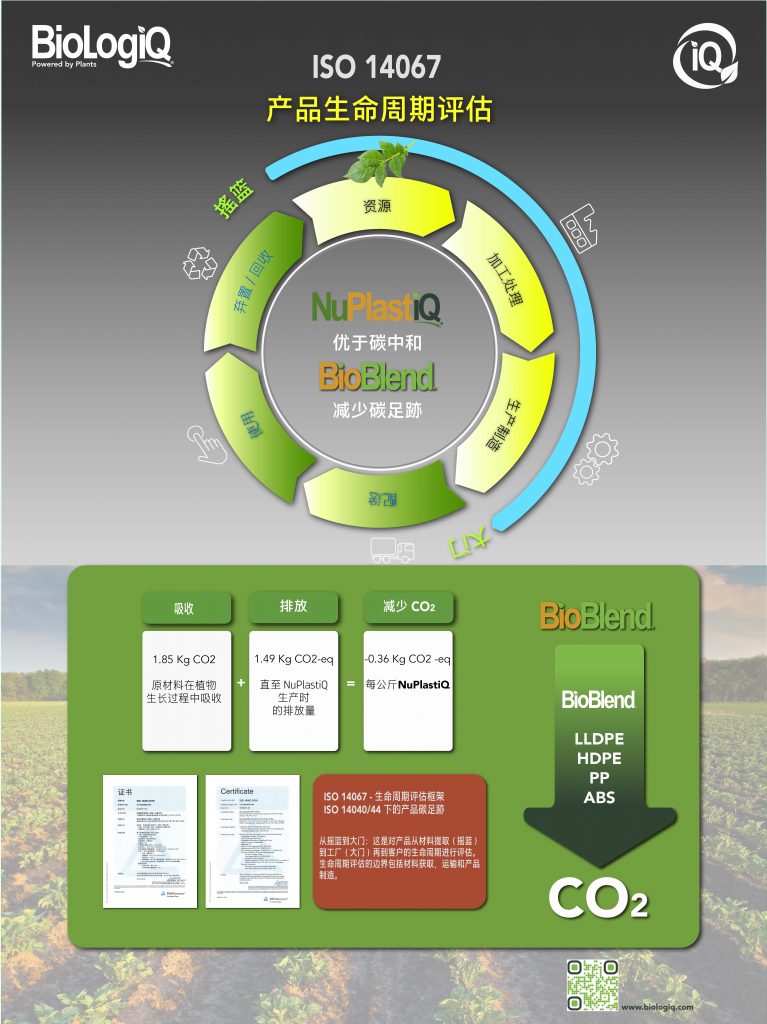
Interim results of a Cradle-to-Gate Life Cycle Assessment (LCA) study carried out by thinkstep, Inc indicate that such work would amount to ~1.4* kilograms of CO2-equivalent (GWP100) emitted for every kilogram of NuPlastiQ manufactured.
These numbers make NuPlastiQ about carbon neutral at BioLogiQ’s gate.
Carbon-neutrality is excellent. And there seems to be room for improvement with more advantaged sources of glycerin and more energy efficient production methods. We are working on it.
A critically reviewed third-party report will be available upon conclusion of current capacity scale up, with new raw material sourcing points established and ongoing energy efficiency measures implemented.
* 1.4 includes emissions related to compounding of NuPlastiQ with LDPE in a 50/50 BioBlend . For clarity purposes, CO2-equiv burden of LDPE will be added in the following step.
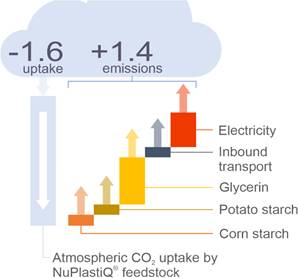
IV. Estimate your potential saving: NuPlastiQ % ≈ GHG saving % in 1:1 ratio replacement use cases**
As demonstrated above, NuPlastiQ is roughly carbon neutral at BioLogiQ’s gate.
That makes estimating the resin related GHG saving, at your gate, as simple as:
- Learn the “at gate” GWP (Global Warming Potential) value for your base resin from a reputable source, such as https://www.plasticseurope.org/en/resources/eco-profiles.
- E.g. GWP100 for 1 kg of LDPE is listed as 1.87 kg CO (GWP100)
- Calculate GWP saving for your use case.
- E.g. 1:1 replacement ratio (by weight), 30% NuPlastiQ blended with 70% LDPE:
- Before: 1 kg of LDPE x 1.87 = 1.87 kg CO2-eq.
- After: [0.3 kg of NuPlastiQ x 0] + [0.7 kg of LDPE x 1.87] = 1.31 kg CO2-eq.
- Net saving: 1- [1.31 ÷ 1.87] = 30% lower resin related GWP at factory gate
- E.g. Final structure 10% heavier for same function, 30% NuPlastiQ blended with 70% LDPE:
- Before: 1 kg of LDPE x 1.87 = 1.87 kg CO2-eq.
- After: [0.33 kg of NuPlastiQ x 0] + [0.77 kg of LDPE x 1.87] = 1.44 kg CO2-eq.
- Net saving: 1- [1.44 ÷ 1.87] = 23% lower resin related GWP at factory gate
- Note: A heavier structure “at gate” will have downstream GWP implications (more energy for transport, etc.). Estimated saving “at gate” will likely be reduced.
- E.g. Final structure 10% lighter for same function, 30% NuPlastiQ blended with 70% LDPE:
- Before: 1 kg of LDPE x 1.87 = 1.87 kg CO2-eq.
- After: [0.27 kg of NuPlastiQ x 0] + [0.63 kg of LDPE x 1.87] = 1.18 kg CO2-eq.
- Net saving: 1- [1.18 ÷ 1.87] = 37% lower resin related GWP at factory gate
- E.g. 1:1 replacement ratio (by weight), 30% NuPlastiQ blended with 70% LDPE:
- Get an idea of what the saving represents by using comparative tools such as EPA’s “Greenhouse Gas Equivalencies Calculator“.
- E.g. 30% NuPlastiQ, 1:1 by weight, 100 metric tons of packaging per year
- Before: 100,000 kg of LDPE x 1.87 = 187 metric tons of CO
- After: [30,000 kg of NuPlastiQ x 0] + [70,000 kg of LDPE x 1.87] = 131 metric tons of CO
- Net saving: 187 – 131 = 56 metric tons of CO per year (resin related GWP at factory gate)
- EPA’s tool calculated GHG equivalency (Aug 5th 2019): 19.5 metric tons of waste recycled instead of landfilled per year.
- E.g. 30% NuPlastiQ, 1:1 by weight, 100 metric tons of packaging per year
Note: Please recognize the limitations of these simplified calculations. While useful to estimate resin related benefits, they do not include all elements needed to calculate the GWP of a final product: printing inks, label, resin processing energy (e.g. injection molding), etc. Consult an LCA expert prior to making GHG-related claims.
** when blending NuPlastiQ to fossil-based resins. 1:1 replacement ratio by weight. Comparison of ready to use resin blend at factory’s gate.
V. What do resin related GHG differences look like “beyond the gate”?
Now things can get really complex, really fast! So to simplify, we are limiting our comparisons to LDPE.
- The below analysis is limited to emissions directly related to the different plastic resin blends;
- Emissions related to transport beyond manufacturers’ gates, resin processing into packaging or final product, etc. are out of scope since they are expected to be very similar irrespective of the different resin blends;
- For the purposes of this analysis, it is assumed that different resin blends perform exact same function until the use stage;
- It is known that different resin blends may behave differently at the end-of-life. GHG differences may be relevant;
- Additionally, different end-of-life treatments may greatly influence resin related GHG differences;
- The below analysis is not an attempt to offer an exhaustive explanation, but rather to present how a range of likely end-of-life possibilities might affect resin related GHG profiles.
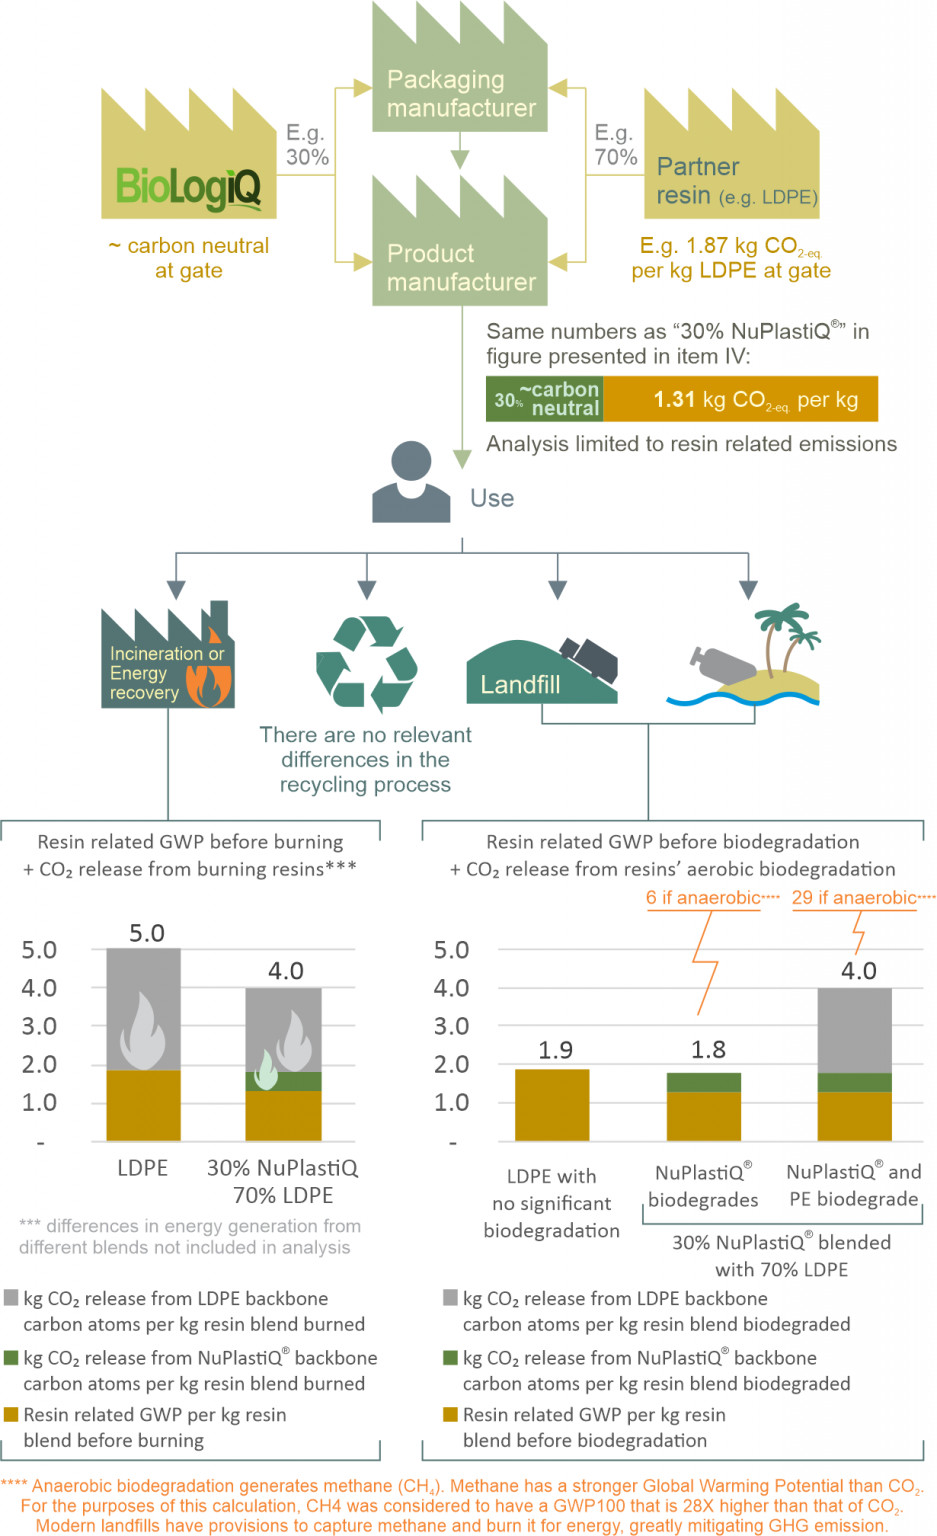
Takeaways:
- In the incineration scenario, very common in Western Europe and Japan, blended with LDPE is GHG advantaged over the pure LDPE counterpart;
- In the recycling scenario, no significant resin-induced differences are expected in the GHG profile. Carbon atoms from the different blends remain in the respective backbones. No significant differences expected in the recycling process itself (e.g. water and energy for washing, energy for pelletizing, etc.);
- Landfill and environmental leakage scenarios share a common factor regarding resin related GHG differentiation; Biodegradation.
- LDPE (similarly to other polyethylene families, polypropylene or polystyrene) is known to biodegrade very slowly even under ideal conditions, with negligible emissions in the first 100 years (GWP100). LDPE, therefore, is not expected to “grow” its GWP100 footprint in landfills or when leaked to the environment.
- NuPlastiQ blended with LDPE will have its carbon footprint affected by the biodegradation conditions:
- If the condition is not prone to biodegradation (e.g. paper not biodegrading in a given landfill), the blend will keep its carbon atoms and the GHG profile will be unaffected;
- If the condition is prone to biodegradation, such as defined in an ASTM D5338 setting, the entire blend (NuPlastiQ and LDPE) could biodegrade. In this case, NuPlastiQ blended with LDPE would have a disadvantaged GHG profile if compared to pure LDPE. But it would also have performed an additional function (e.g. mitigation of environmental leakage), rendering the GHG comparison less relevant due to comparing systems with different functions;
- A “partial” scenario has been added limiting biodegradation to only the NuPlastiQ portion of the blend (LDPE in blend would not biodegrade). While BioLogiQ hasn’t seen experimental evidence to support such scenario, it has been included for curiosity purposes.
VI. Summary
- offers significant cradle-to-gate GHG benefits when blended with fossil-based resins;
- maintains its GHG advantage in controlled end-of-life scenarios, such as incineration, recycling and landfills with methane capture;
- NuPlastiQ and LDPE (or other polyolefin) BioBlends will have a disadvantaged GHG profile (compared to pure polyolefin) if biodegradation occurs in uncontrolled environments such as the soil or ocean. But a disadvantaged GHG profile is expected when looking at a biodegradable product against one that isn’t biodegradable. At this point, a fair comparison would look at the blend in question compared to other viable technologies to mitigate environmental leakage and persistence.
In depth:
I. NuPlastiQ is a plant-based thermoplastic. Every carbon in its backbone came from atmospheric CO2.
- Plants use sunlight (light energy) to make “foods” (chemical energy) from carbon dioxide CO2 and water H2O;
- This chemical energy is stored in carbohydrate molecules, such as starches and sugars;
- The basic chemical formula of starch, our primary ingredient for NuPlastiQ, is (C6H10O5)n and its carbon atoms came from atmospheric CO2;
- The same goes for plant-based Glycerin, the other ingredient in NuPlastiQ. With chemical formula C3H8O3, all its carbons came from atmospheric CO2.

II. CO2 uptake to make one kilogram of NuPlastiQ :

Carbon atoms in one kilogram of NuPlastiQ were absorbed by plants from the atmosphere during photosynthesis as ~1.6 kilograms of CO2.
- 1 kg of NuPlastiQ consists of approximately 440 grams of carbon, 60 grams of hydrogen and 500 grams of oxygen;
- 1 kg of CO2 consists of approximately 273 grams of carbon and 727 grams of oxygen;
- In order to obtain the 440 grams of carbon needed to make 1 kg of NuPlastiQ, ~1.6 kg of CO2 needs to be taken from the atmosphere by plants (440 ÷ 273≈1.6).
Note: If NuPlastiQ is biodegraded at the end of its life, its carbons are returned to the atmosphere in the form of CO2 or the less desirable CH4.
III. CO2 emissions to make one kilogram of NuPlastiQ :
There’s a lot of work to convert atmospheric CO2 into ready-to-use NuPlastiQ:
Diesel for agriculture, fertilizer production and use-related emissions, energy for starch and NuPlastiQ processing, diesel for transportation, etc.
Interim results of a Cradle-to-Gate Life Cycle Assessment (LCA) study carried out by thinkstep, Inc indicate that such work would amount to ~1.4* kilograms of CO2-equivalent (GWP100) emitted for every kilogram of NuPlastiQ manufactured.
These numbers make NuPlastiQ about carbon neutral at BioLogiQ’s gate.
Carbon-neutrality is excellent. And there seems to be room for improvement with more advantaged sources of glycerin and more energy efficient production methods. We are working on it.
A critically reviewed third-party report will be available upon conclusion of current capacity scale up, with new raw material sourcing points established and ongoing energy efficiency measures implemented.
* 1.4 includes emissions related to compounding of NuPlastiQ with LDPE in a 50/50 BioBlend . For clarity purposes, CO2-equiv burden of LDPE will be added in the following step.

IV. Estimate your potential saving: NuPlastiQ % ≈ GHG saving % in 1:1 ratio replacement use cases**
As demonstrated above, NuPlastiQ is roughly carbon neutral at BioLogiQ’s gate.
That makes estimating the resin related GHG saving, at your gate, as simple as:
- Learn the “at gate” GWP (Global Warming Potential) value for your base resin from a reputable source, such as https://www.plasticseurope.org/en/resources/eco-profiles.
- E.g. GWP100 for 1 kg of LDPE is listed as 1.87 kg CO (GWP100)
- Calculate GWP saving for your use case.
- E.g. 1:1 replacement ratio (by weight),30% NuPlastiQ blended with 70% LDPE:
- Before: 1 kg of LDPE x 1.87 = 1.87 kg CO2-eq.
- After: [0.3 kg of NuPlastiQ x 0] + [0.7 kg of LDPE x 1.87] = 1.31 kg CO2-eq.
- Net saving: 1- [1.31 ÷ 1.87] = 30% lower resin related GWP at factory gate
- E.g. Final structure 10% heavier for same function, 30% NuPlastiQ blended with 70% LDPE:
- Before: 1 kg of LDPE x 1.87 = 1.87 kg CO2-eq.
- After: [0.33 kg of NuPlastiQ x 0] + [0.77 kg of LDPE x 1.87] = 1.44 kg CO2-eq.
- Net saving: 1- [1.44 ÷ 1.87] = 23% lower resin related GWP at factory gate
- Note: A heavier structure “at gate” will have downstream GWP implications (more energy for transport, etc.). Estimated saving “at gate” will likely be reduced.
- E.g. Final structure 10% lighter for same function, 30% NuPlastiQ blended with 70% LDPE:
- Before: 1 kg of LDPE x 1.87 = 1.87 kg CO2-eq.
- After: [0.27 kg of NuPlastiQ x 0] + [0.63 kg of LDPE x 1.87] = 1.18 kg CO2-eq.
- Net saving: 1- [1.18 ÷ 1.87] = 37% lower resin related GWP at factory gate
- E.g. 1:1 replacement ratio (by weight),30% NuPlastiQ blended with 70% LDPE:
- Get an idea of what the saving represents by using comparative tools such as EPA’s “Greenhouse Gas Equivalencies Calculator“.
- E.g. 30% NuPlastiQ, 1:1 by weight, 100 metric tons of packaging per year
- Before: 100,000 kg of LDPE x 1.87 = 187 metric tons of CO
- After: [30,000 kg of NuPlastiQ x 0] + [70,000 kg of LDPE x 1.87] = 131 metric tons of CO
- Net saving: 187 – 131 = 56 metric tons of CO per year (resin related GWP at factory gate)
- EPA’s tool calculated GHG equivalency (Aug 5th 2019): 19.5 metric tons of waste recycled instead of landfilled per year.
- E.g. 30% NuPlastiQ, 1:1 by weight, 100 metric tons of packaging per year
Note: Please recognize the limitations of these simplified calculations. While useful to estimate resin related benefits, they do not include all elements needed to calculate the GWP of a final product: printing inks, label, resin processing energy (e.g. injection molding), etc. Consult an LCA expert prior to making GHG-related claims.
** when blending NuPlastiQ to fossil-based resins. 1:1 replacement ratio by weight. Comparison of ready to use resin blend at factory’s gate.
V. What do resin related GHG differences look like “beyond the gate”?
Now things can get really complex, really fast! So to simplify, we are limiting our comparisons to LDPE.
- The below analysis is limited to emissions directly related to the different plastic resin blends;
- Emissions related to transport beyond manufacturers’ gates, resin processing into packaging or final product, etc. are out of scope since they are expected to be very similar irrespective of the different resin blends;
- For the purposes of this analysis, it is assumed that different resin blends perform exact same function until the use stage;
- It is known that different resin blends may behave differently at the end-of-life. GHG differences may be relevant;
- Additionally, different end-of-life treatments may greatly influence resin related GHG differences;
- The below analysis is not an attempt to offer an exhaustive explanation, but rather to present how a range of likely end-of-life possibilities might affect resin related GHG profiles.

Takeaways:
- In the incineration scenario, very common in Western Europe and Japan, blended with LDPE is GHG advantaged over the pure LDPE counterpart;
- In the recycling scenario, no significant resin-induced differences are expected in the GHG profile. Carbon atoms from the different blends remain in the respective backbones. No significant differences expected in the recycling process itself (e.g. water and energy for washing, energy for pelletizing, etc.);
- Landfill and environmental leakage scenarios share a common factor regarding resin related GHG differentiation; Biodegradation.
- LDPE (similarly to other polyethylene families, polypropylene or polystyrene) is known to biodegrade very slowly even under ideal conditions, with negligible emissions in the first 100 years (GWP100). LDPE, therefore, is not expected to “grow” its GWP100 footprint in landfills or when leaked to the environment.
- NuPlastiQ blended with LDPE will have its carbon footprint affected by the biodegradation conditions:
- If the condition is not prone to biodegradation (e.g. paper not biodegrading in a given landfill), the blend will keep its carbon atoms and the GHG profile will be unaffected;
- If the condition is prone to biodegradation, such as defined in an ASTM D5338 setting, the entire blend (NuPlastiQ and LDPE) could biodegrade. In this case, NuPlastiQ blended with LDPE would have a disadvantaged GHG profile if compared to pure LDPE. But it would also have performed an additional function (e.g. mitigation of environmental leakage), rendering the GHG comparison less relevant due to comparing systems with different functions;
- A “partial” scenario has been added limiting biodegradation to only the NuPlastiQ portion of the blend (LDPE in blend would not biodegrade). While BioLogiQ hasn’t seen experimental evidence to support such scenario, it has been included for curiosity purposes.
VI. Summary
- offers significant cradle-to-gate GHG benefits when blended with fossil-based resins;
- maintains its GHG advantage in controlled end-of-life scenarios, such as incineration, recycling and landfills with methane capture;
- NuPlastiQ and LDPE (or other polyolefin) BioBlends will have a disadvantaged GHG profile (compared to pure polyolefin) if biodegradation occurs in uncontrolled environments such as the soil or ocean. But a disadvantaged GHG profile is expected when looking at a biodegradable product against one that isn’t biodegradable. At this point, a fair comparison would look at the blend in question compared to other viable technologies to mitigate environmental leakage and persistence.
生物降解和可堆肥性能
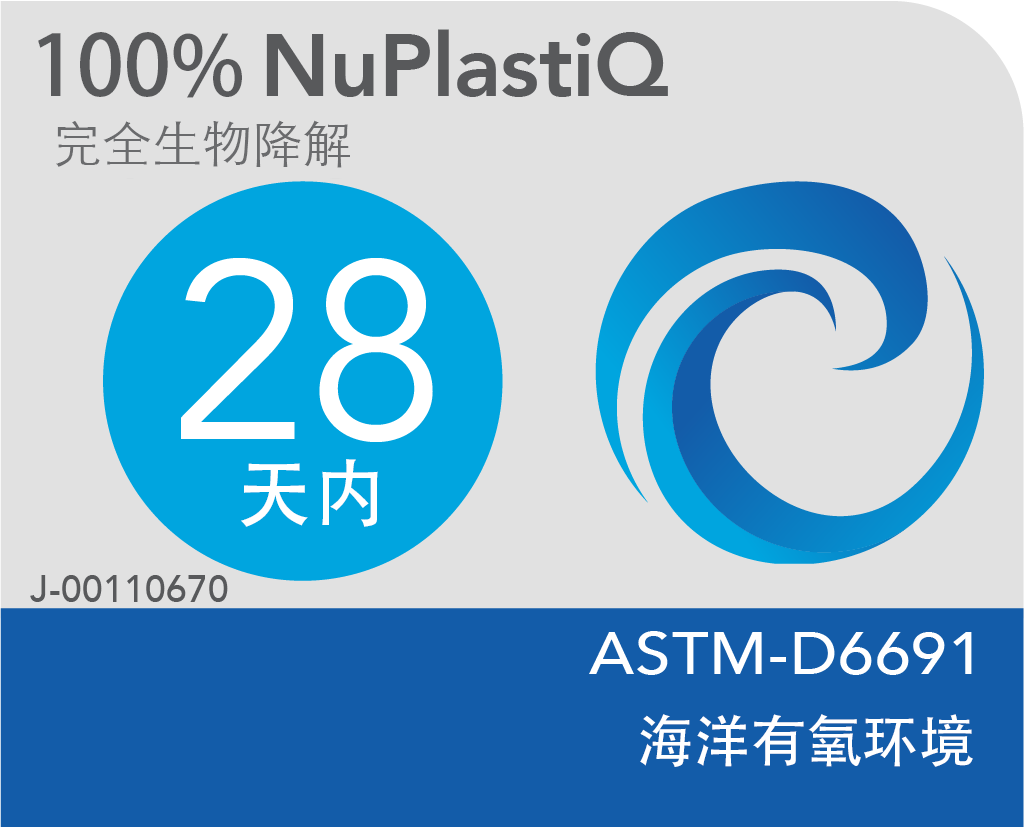
使用 BioLogiQ 的 NuPlastiQ 制造的产品, 耐用且产品寿命稳定, 不会仅因为氧气或紫外线而加速碎片化。
BioBlend BC 系列:
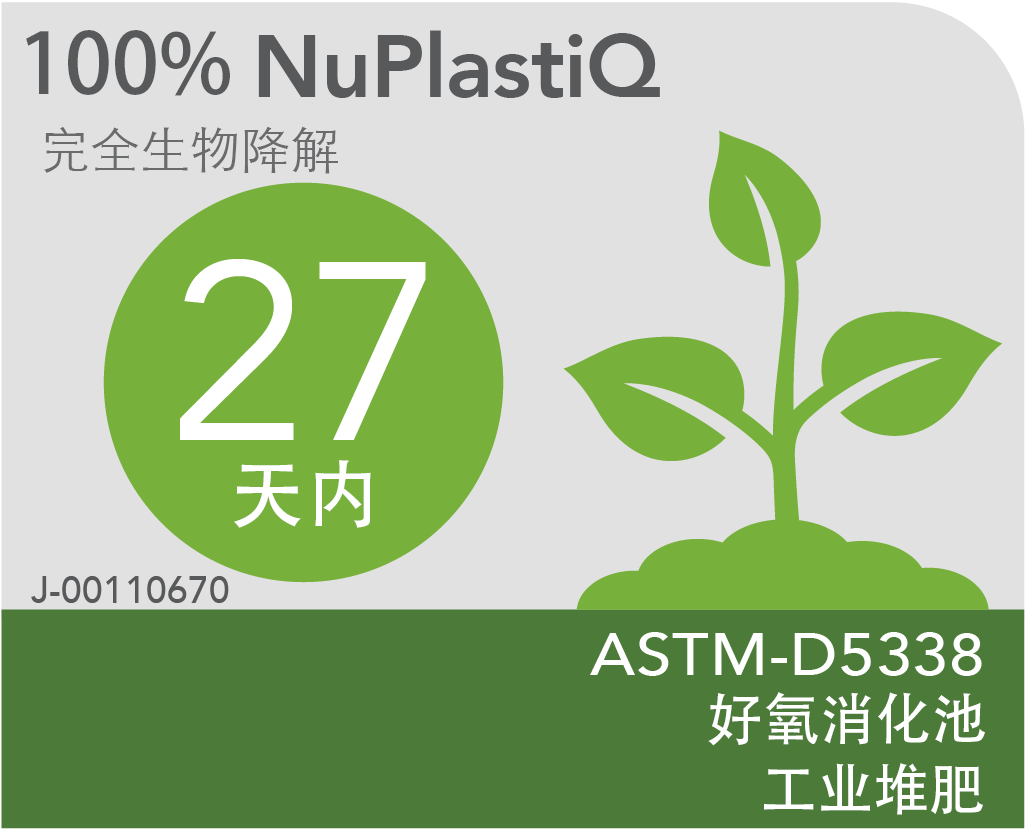
NuPlastiQ 通常会加速可堆肥树脂(如 PBS、PHA、PBAT 或 PLA)的生物降解性,从而扩大可认证应用的范围。 根据 ASTM D5338 和 D6691,100% 的 NuPlastiQ 的生物降解速度与纤维素一样快。
NuPlastiQ 和多种 BioBlend BC 系列已通过可堆肥性标准化测试,并经 TUV 认证,符合 ASTM D6400 和 EN 13432 规定的标准。一些 BioBlend BC 系列还通过了中国标准生物降解性测试 GB/T 19277.1-2011。

介绍第四个 ”R“
修复或生物修复
旨在帮助减少塑料污染*在我们的环境和海洋中的积累。
我们都熟悉环境的 3 个“R”——减少、再利用和回收。 NuPlastiQ 为关键的第四个“R”——修复——“改进某些事物或纠正某些错误的过程,特别是改变或停止对环境的破坏 ”铺平了道路。 采取补救措施可以减少泄漏塑料污染环境的时间。 如何实现?
Nature has developed a way to biodegrade durable polymers such as cellulose and lignin. Like wood, plastics may aspire to be durable and compatible with nature’s biodegradation systems. NuPlastiQ seems to enable nature to use its biodegradation toolbox in blends with PE, PP and PS. A possibility demonstrated in dozens of studies and that does not seem to be accelerating fragmentation. The addition of NuPlastiQ in PE, PP and PS can only reduce the potential for persistent microplastics accumulation in the environment.
能诱发生物修复,使自然存在的微生物能够对遗留在环境的塑料进行生物修复。
Meet EBT: Embedded Bioremediation Triggers
Copyright © 2021 BioLogiQ, Inc. All rights reserved. Although BioLogiQ, Inc. and its affiliates (“BioLogiQ”) have taken reasonable steps to ensure the accuracy of the information presented in this infographic, BioLogiQ makes no representations or warranties with respect to the information provided herein.

